GPS Fleet Tracking
GPS fleet tracking software
The more innovative way to track your fleet. Boost the productivity of fleet operations, reduce running costs, and keep your drivers safe and assets secure.
GPS fleet tracking software
The more innovative way to track your fleet. Boost the productivity of fleet operations, reduce running costs, and keep your drivers safe and assets secure.
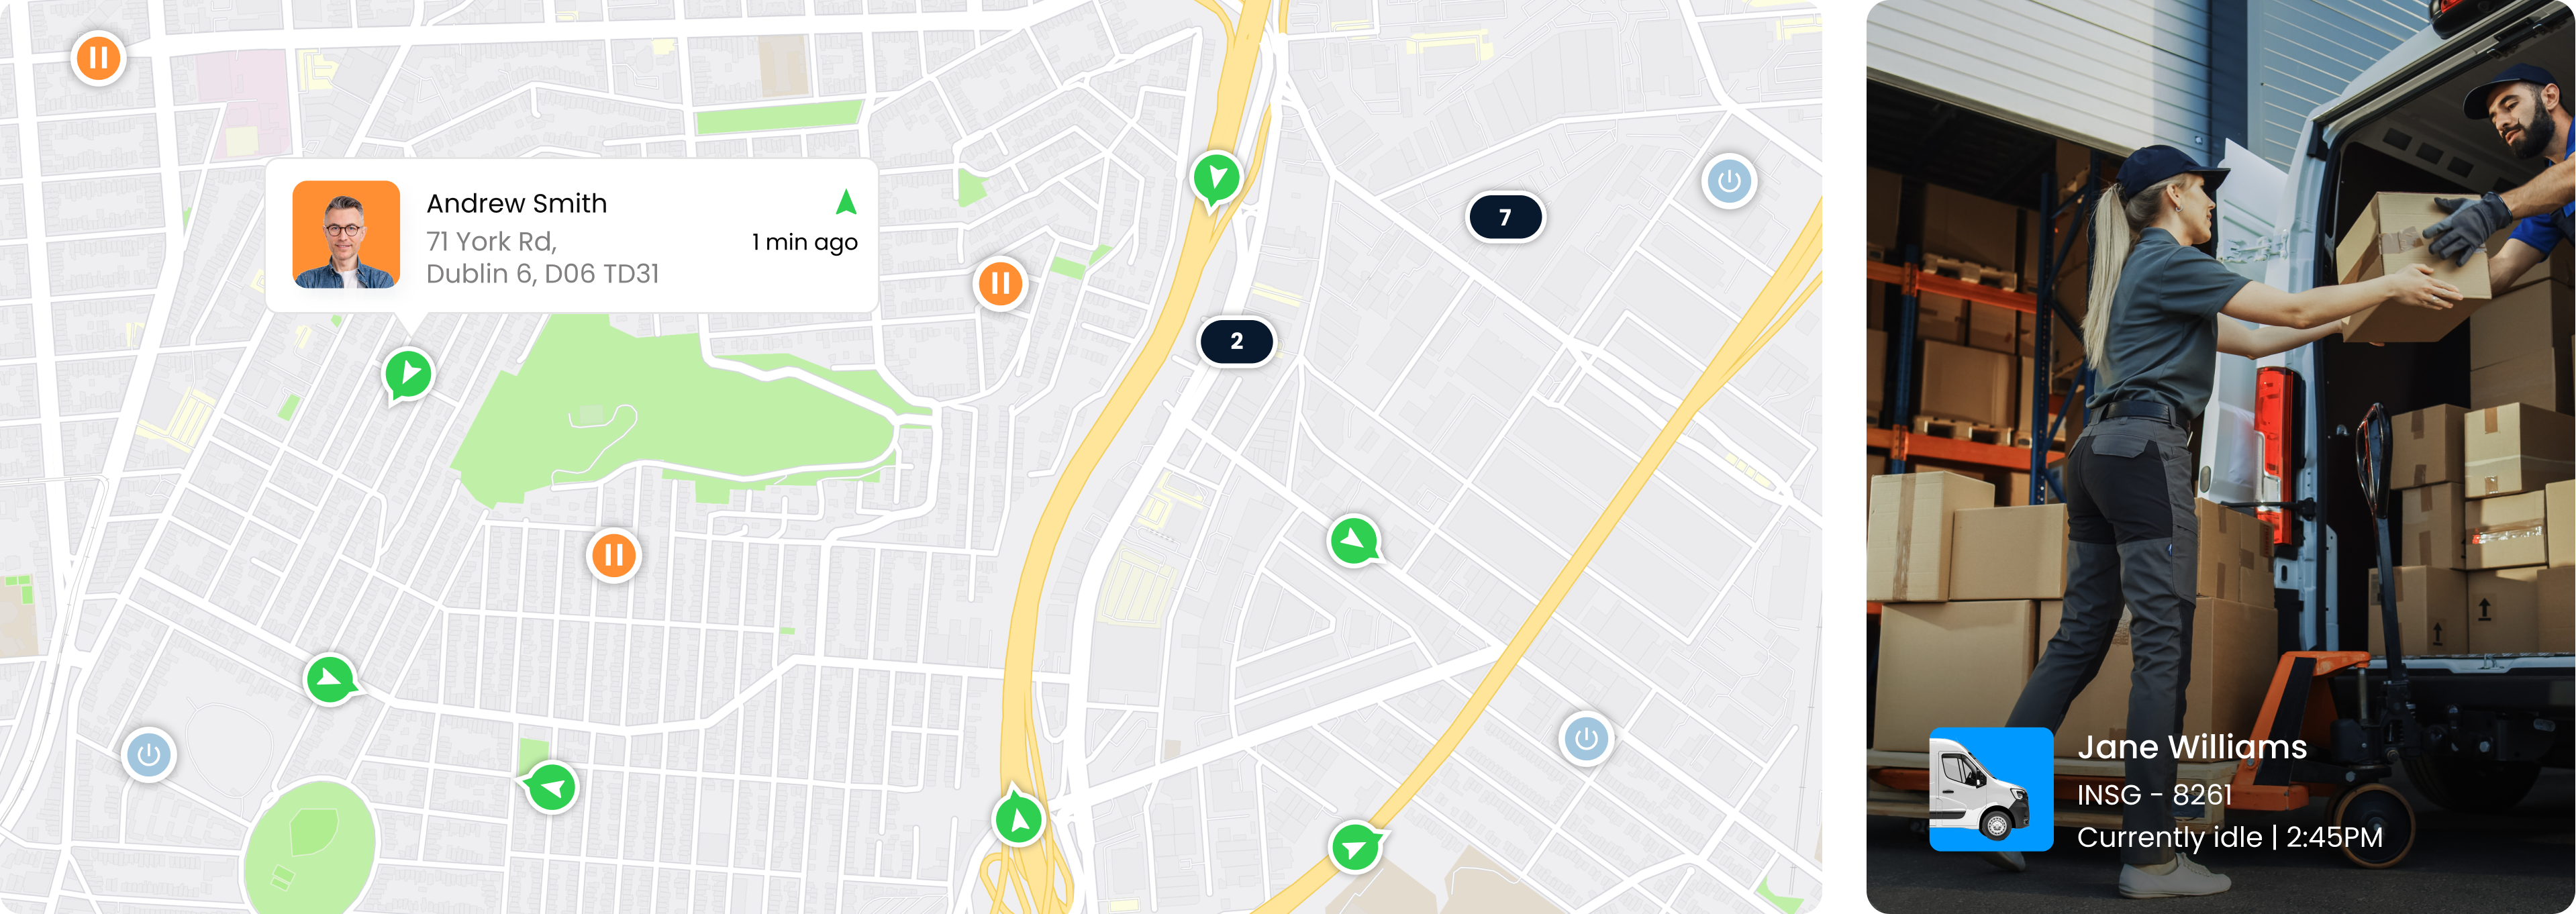
Real-time visibility with live maps
Live Maps give you a bird’s eye view of your entire fleet in real time (or historically with Trip Replay). Dispatch the nearest available worker to a new job, check the status of a driver on their way to the depot or find that generator you need.

“We selected Inseego because of the ease-of-use of the system and its ability to add significant return on investment in terms of increased operational control and enhanced service for our customers”
Jim Black
Sefton Council


Replay any trip and see exactly what happened
With one click you can watch the whole trip unfold — when a driver left, the route they took and everything in between, such as speeds driven and driving events that occurred. Trip Replay animates the journey on your map, allowing you to review all the relevant data, identify route deviations, verify customer jobs and more.
Minimised distracted driving with AI & active monitoring
With road and driver facing cameras you get a much clearer view of what happens on the road, while helping to protect your drivers and cargo. Camera locations, angles and setup can be tailored to suit your fleet vehicles and new videos are automatically uploaded and classified within minutes of a driving event being detected.
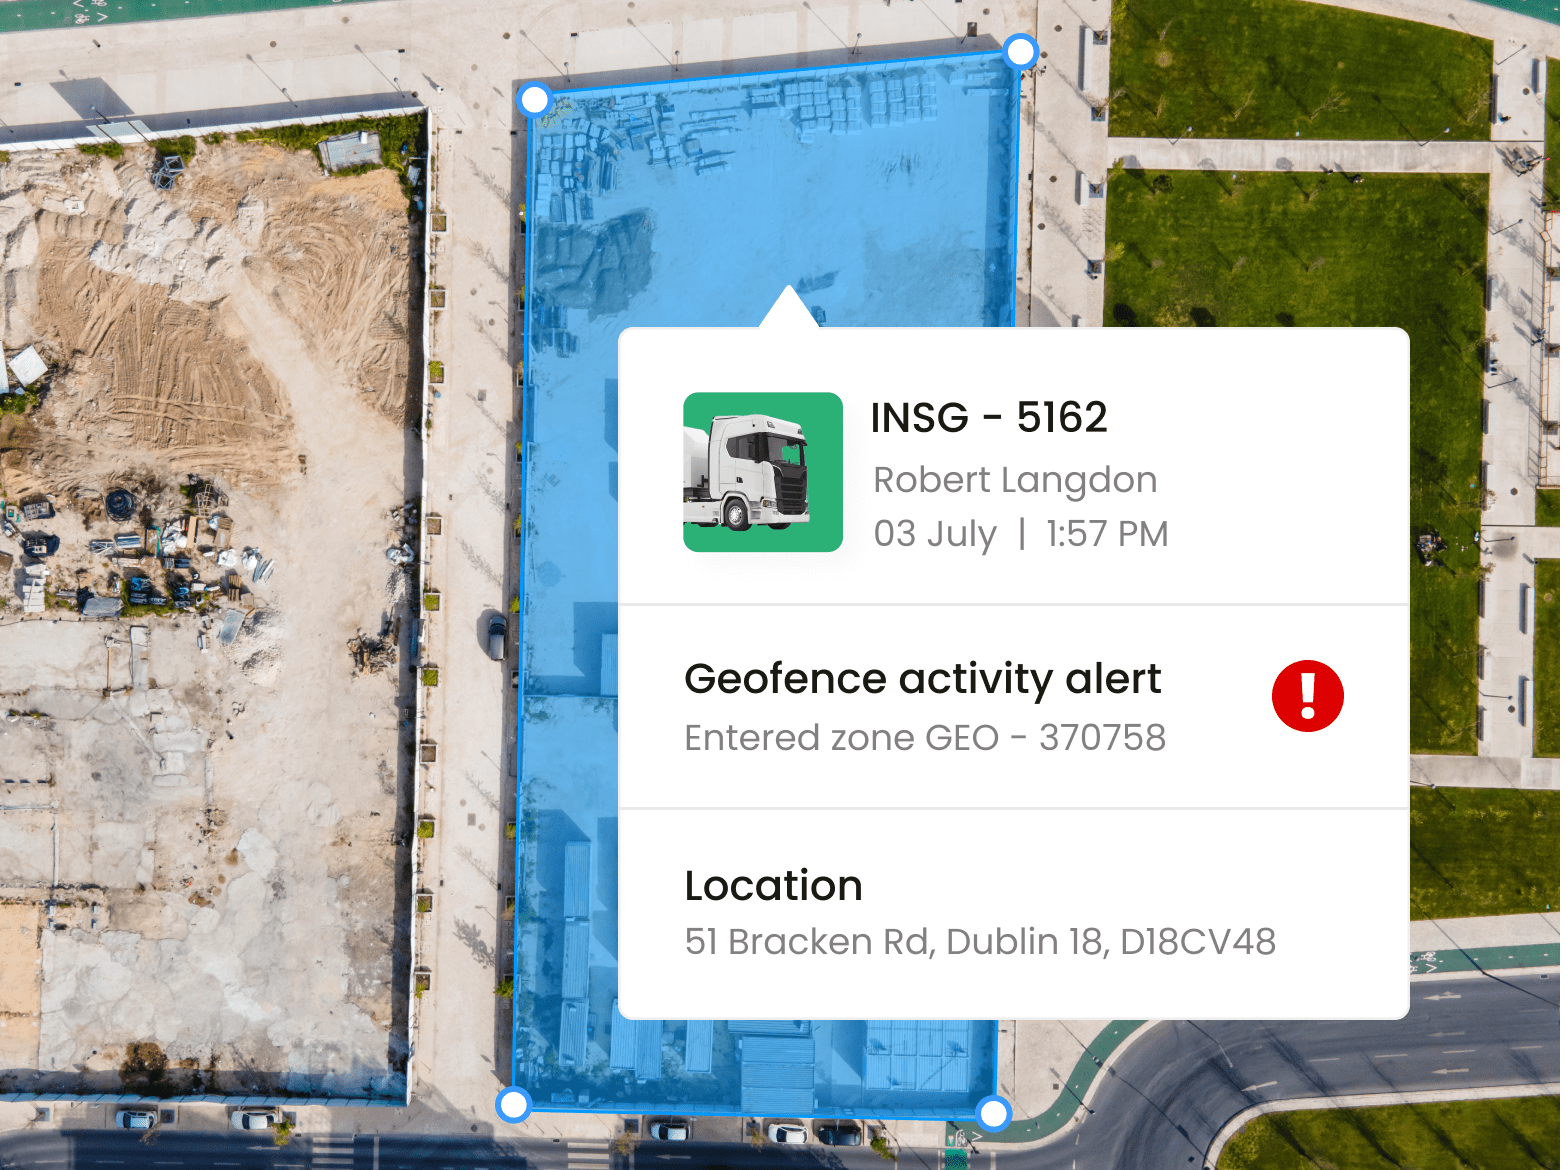
Monitor activity at key locations with Geofences
Add activity monitoring to any location on your map in seconds. Get alerts based on when and where drivers and commercial vehicles are entering, or leaving, a site. Ideal for job sites, depots, storage yards and restricted areas to increase security, verify worker activity or improve compliance with local laws.
“We find the system simple to use, providing us with the exact information and insight we need to better manage our engineering resources and deliver an excellent service while protecting our vehicle fleet.”
Mike Palfrey
Rowland Door Services Limited

Add context to events with dashcam video
With outward and driver facing cameras you get a much clearer picture of what happens on the road, while helping to protect your drivers and cargo.
Inseego offers a wide range of vehicle camera solutions with prices to suit every budget. If you’re looking for a stand-alone camera or a connected solution that’s fully integrated to telematics, or an AI Camera with the ability to help prevent accidents in the first place, we can provide it.
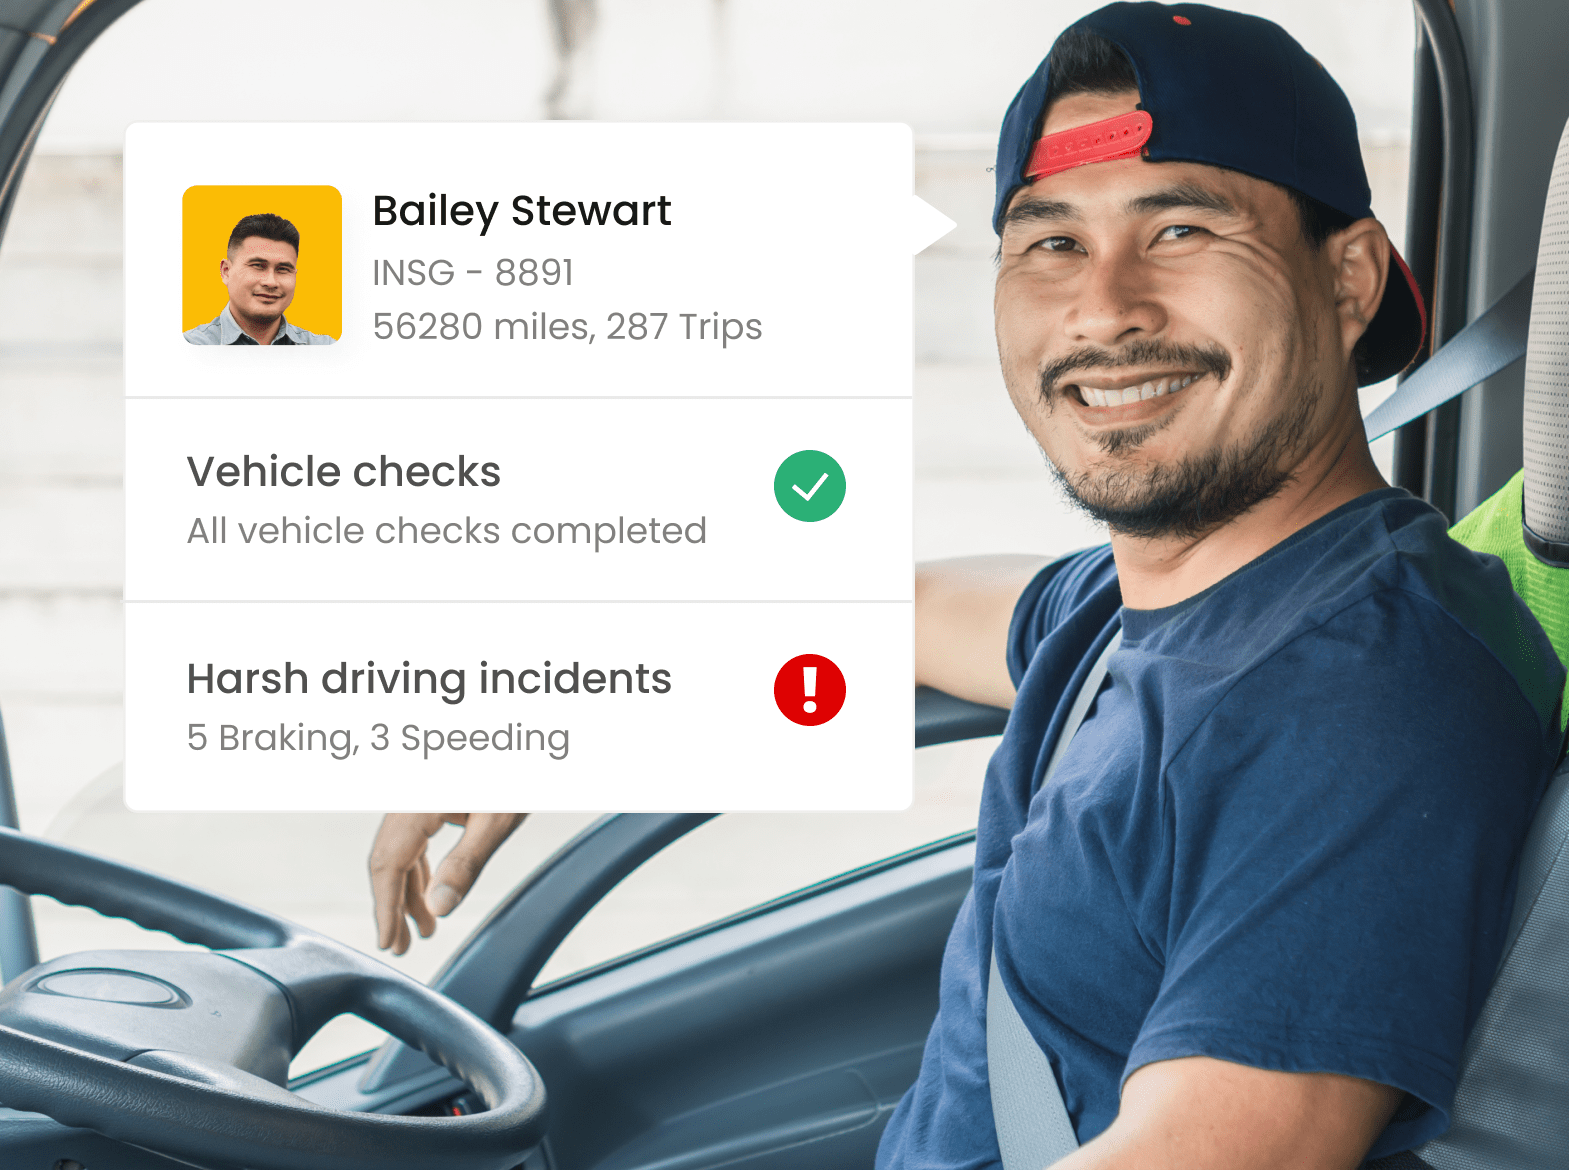
Improve driver safety and performance
Managing your drivers is a lot easier when you have accurate data. Our range of driver management and safety tools, such as Driver ID, colour-coded driving reports, panic buttons and dash cameras, can increase driver accountability, improve performance and keep your team safe.
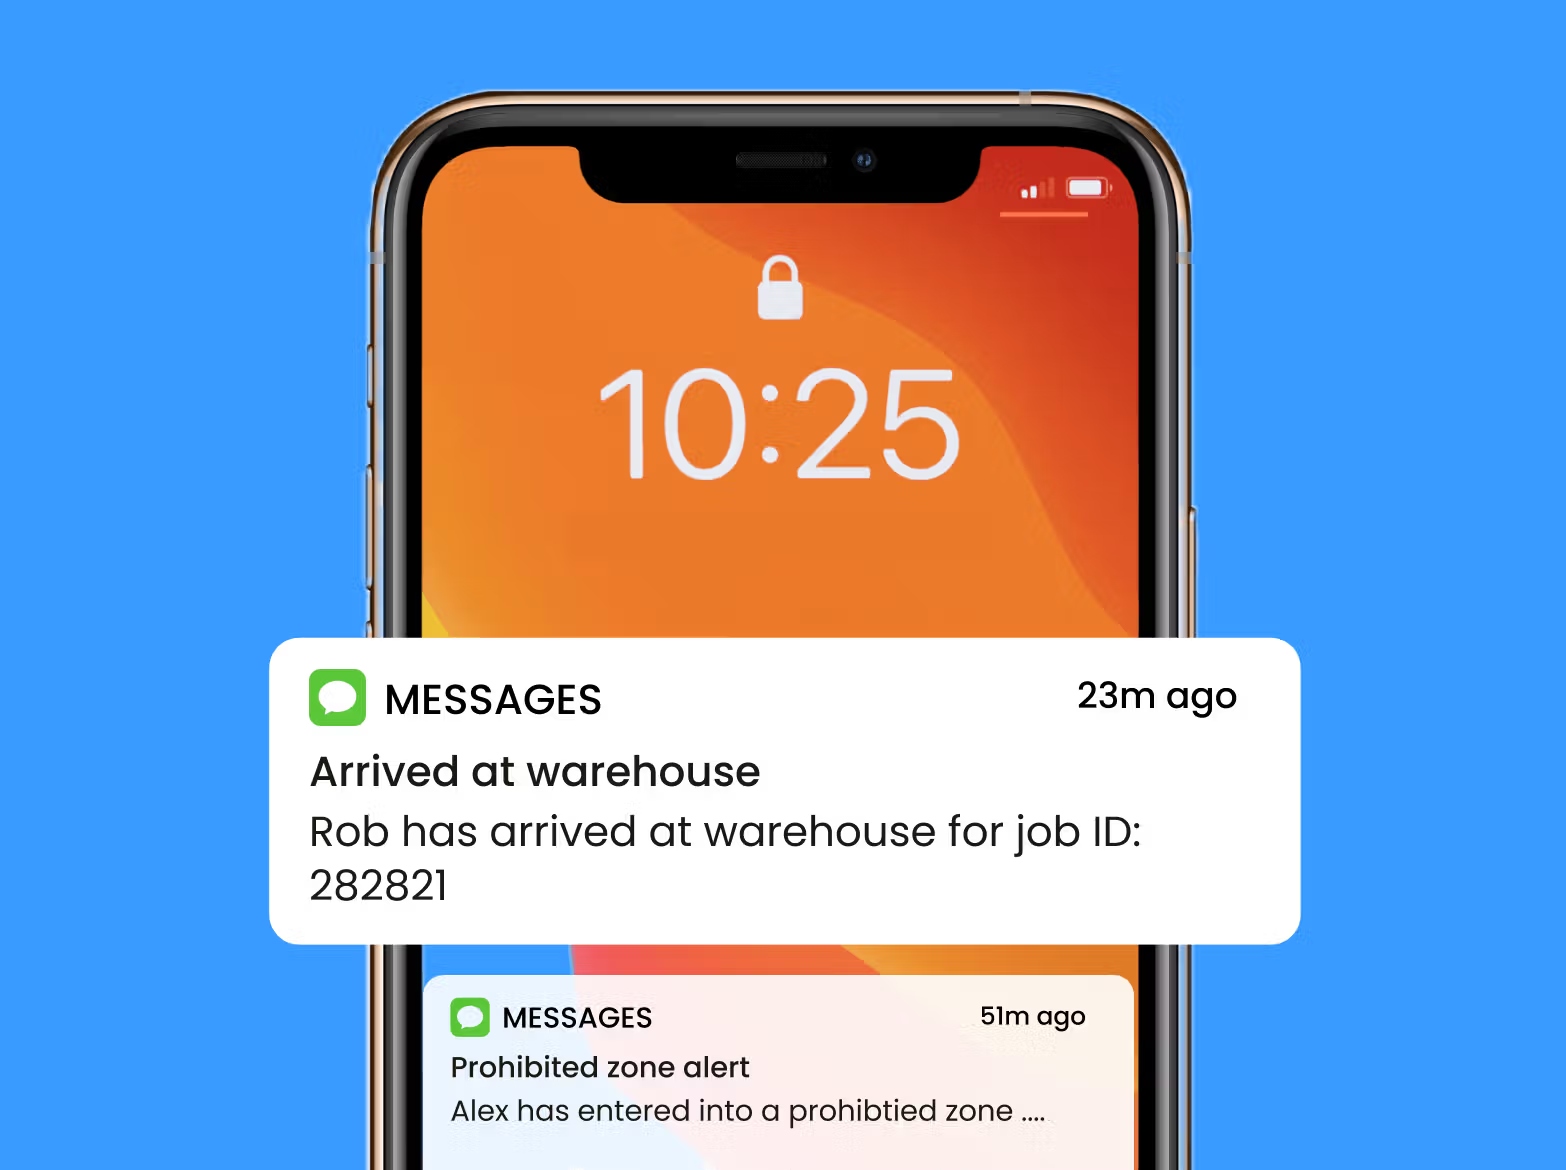
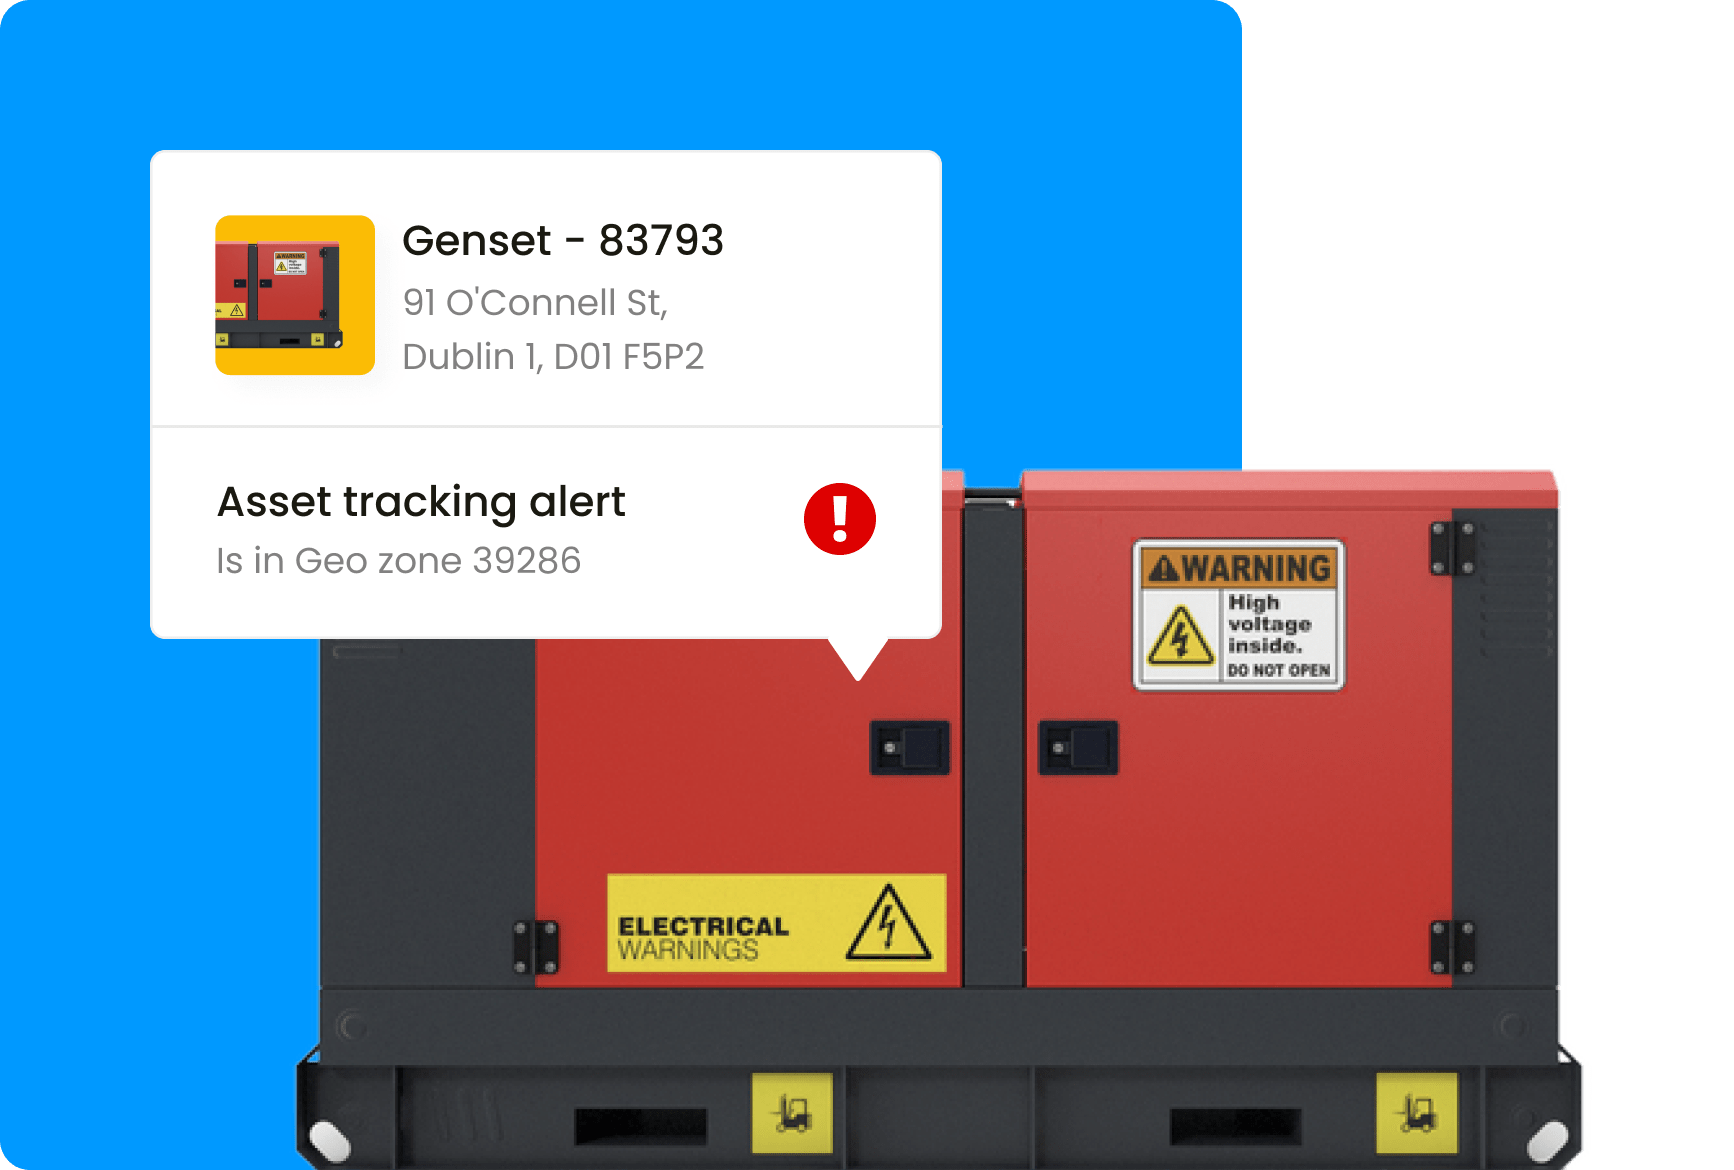
Stay up to date with alerts
Alerts are designed to do the work for you. Get notified when equipment or vehicles are where they shouldn’t be. Reduce dangerous driving by alerting drivers on driving events such as harsh braking and acceleration as they happen. Keep equipment serviced and maintenance costs down with mileage-based service reminders and avoid notification overload with frequency thresholds.
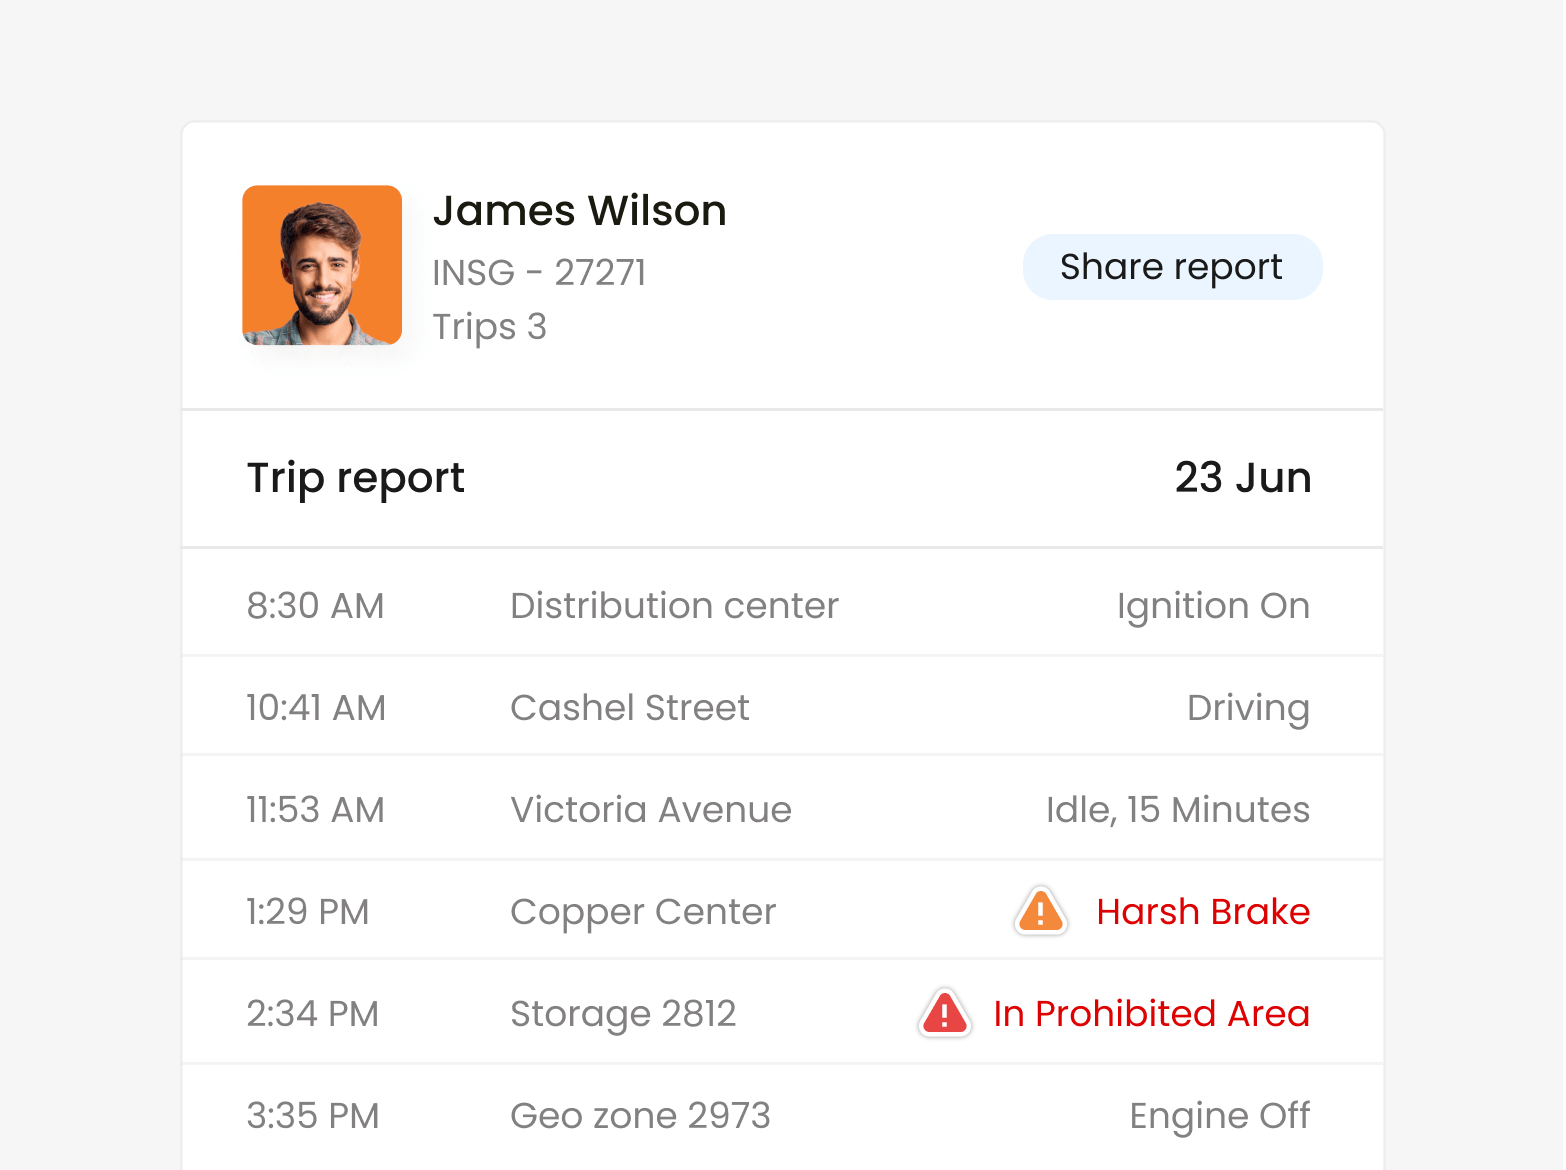
Review mission-critical data with fleet reports
Do you need daily trip reports? Do you need to know about late arrivals? Speeding incidents? Idle time? Driver behaviour? Asset utilisation? Report on a wide range of metrics with on-demand or scheduled reports that can be easily customised and delivered to you at a frequency that suits your workflow.
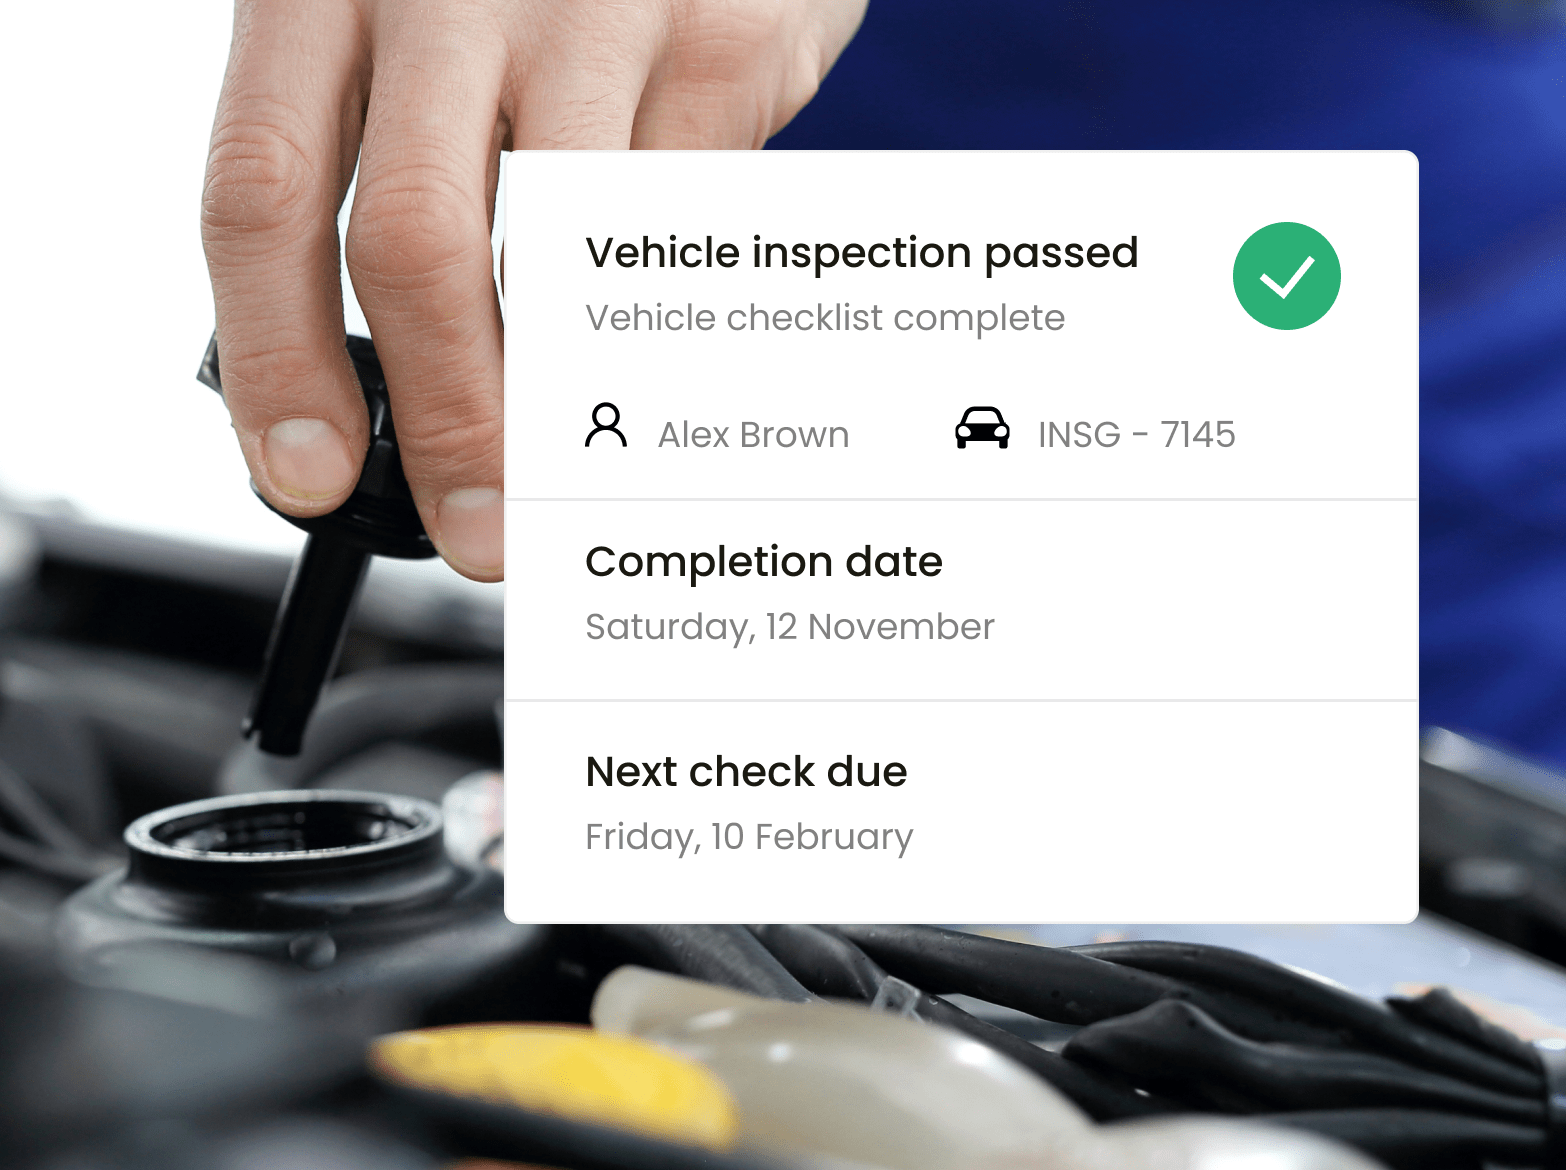
Simplify compliance & improve your Chain of Responsibility
Our vehicle system provides key information to help you and your employees comply with the latest legislation, using real-time and historical data to monitor driver and operational performance.
Streamline your compliance management with automated mileage tracking, trip reporting (business vs. private) and fuel consumption records. Generate scheduled reports that make filing reports a whole lot easier.
Inseego can provide guidance around all HR and legislative compliance related to fleet operations such as Duty of Care, Working Time Directive and Benefit in Kind Tax.
Track both powered and non-powered assets
Finding the nearest cement mixer, trailer or generator is easy with simple place and trace asset tracking. Weather-proof and battery powered, our GPS trackers can report the location of the tools your business relies on, as well as helping with theft recovery and maintenance scheduling.
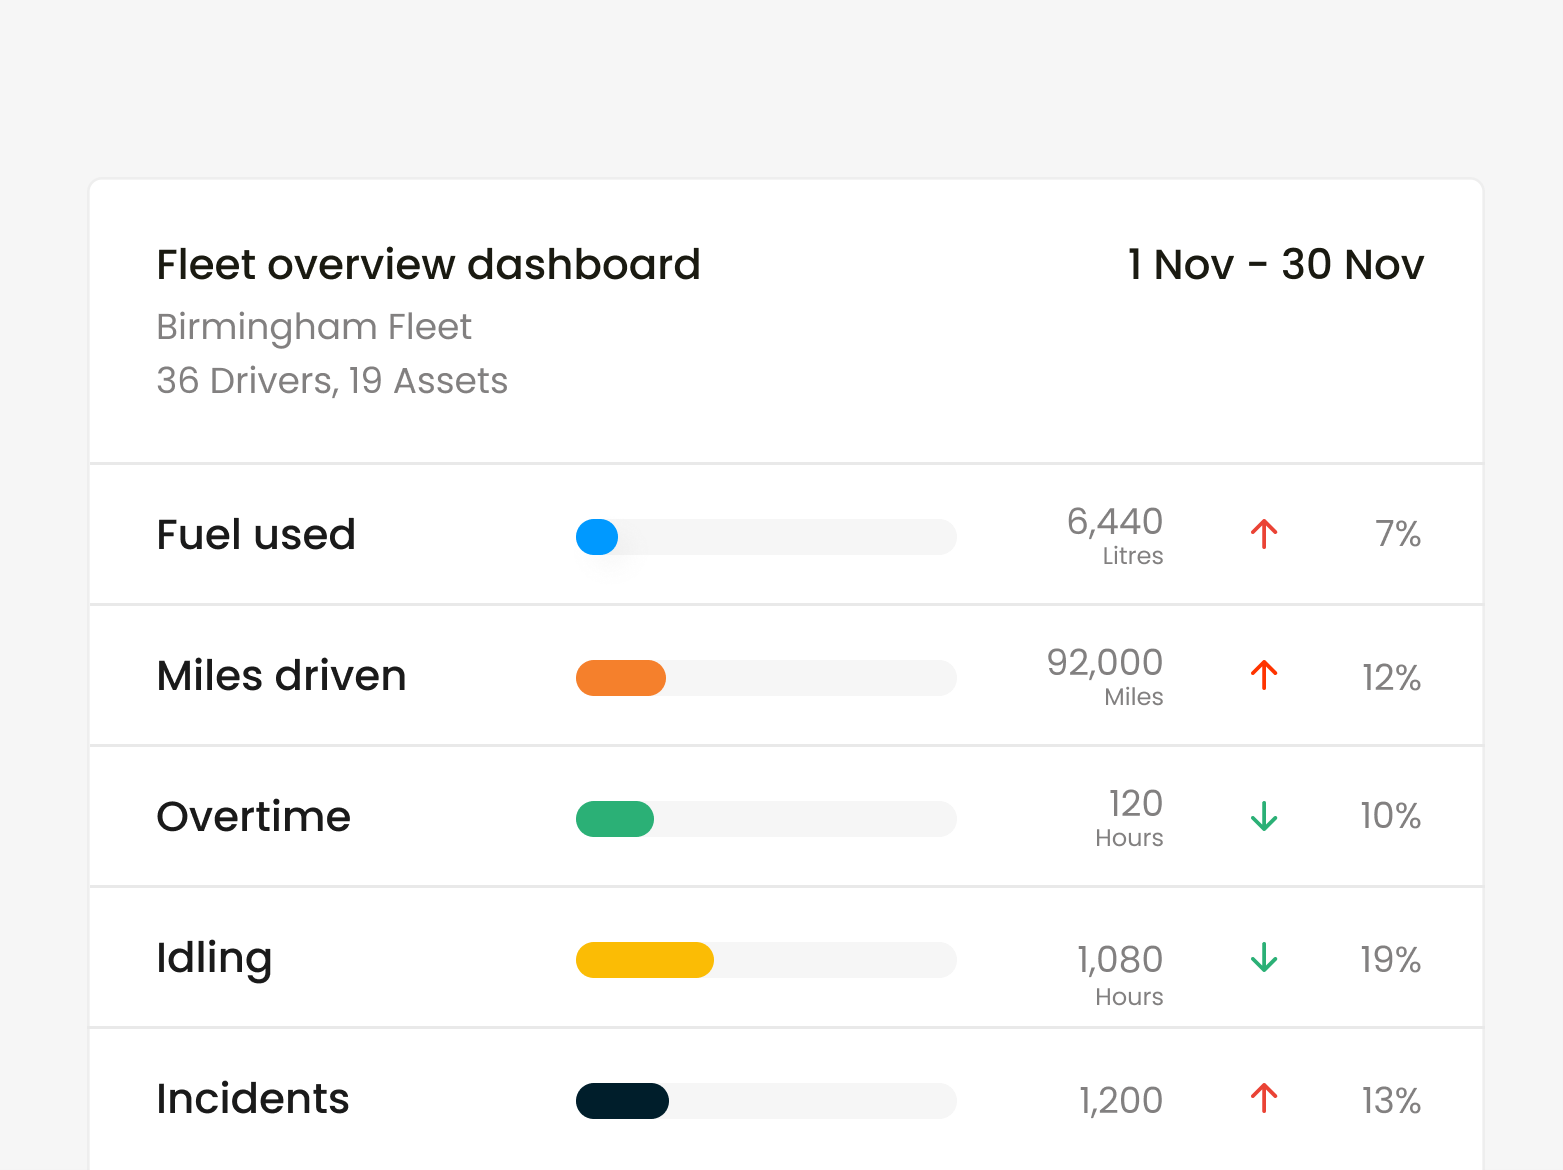
Turn data into action with our intelligent dashboards
Your GPS fleet tracking solution records a lot of valuable information about how your business is performing over time. Our intelligent analytics dashboard converts this data into useful action points and visual trends that can be used to proactively manage your business.

Do more with less, using route optimisation & planning
Lower the cost of your daily routes with automated route optimisation and scheduling. Smart route planning helps your drivers get to their jobs on time, get more done and take on more work — without needing to add more vehicles or staff.

A telematics partner committed to faster ROI
We work alongside you every step of the way to plan and deploy your telematics solution, and get a positive ROI as soon as possible. Get technical support, remote or on-site training and assistance by integrating our platform into other parts of your business.

Custom-fit, or out of the box.
Whether you’re a small niche business, a growing private company or a large government fleet, Inseego offers you the choice of plug-and-play GPS fleet management system or a solution that can be customised and scaled to meet the unique needs and size of your organisation.
Frequently asked questions
What is real-time fleet tracking?
Real-time fleet tracking is GPS fleet tracking software that is reading data received from fleet tracking devices, as it happens.
GPS trackers, when active, send a continuous stream of data to central servers, which immediately process this data and display it accordingly in the fleet managers' application.
This means that the information or GPS data, displayed on the screen is as close as possible to what is actually happening on the road or construction site.
This real-time GPS reporting means managers can make effective decisions based on the most recent data coming in from the field.
How does GPS fleet tracking work?
Today’s fleets own a wide range of assets, from cars, vans and trucks to generators, tools, and other equipment. These assets generate a lot of data, much of which can be captured by a GPS tracking device.
A GPS tracking device can be wired into an asset to collect the information generated by the asset — engine hours, odometer readings, fault codes etc. — and combine it with its own position data, and send all this information to a central server over a mobile network (satellite networks are an option for assets in very remote areas).
In situations where a mobile network is temporarily unavailable (e.g. going through a tunnel or in very rural locations) the device will continue to record and send this backlog of data as soon as it reconnects.
This central server collects, collates and stores all the information sent by these GPS tracking devices. It can then be read by GPS fleet tracking software, which turns all this data into usable information for fleet managers.
How do I know if fleet tracking is right for my business?
If your business has money invested in mobile assets — vehicles, people or assets — then GPS fleet tracking is definitely something you should consider. GPS tracking solutions help you make sure you are using all your mobile resources efficiently.
Without a fleet tracking system, a business could be losing money with under-utilised assets, wasteful driving behaviour or poor job scheduling. GPS fleet tracking makes it easy to identify areas of your business that you can optimise, boosting productivity and reducing running costs.
Fleet tracking can also improve safety, monitoring driver behaviour in real time and encouraging staff to be more responsible.
Why should I choose Inseego over other providers?
Inseego (previously known as Ctrack) has been established in the telematics industry for more than 35 years, with a huge amount of experience deploying vehicle tracking and camera solutions to fleets across many different industries throughout Ireland.
Inseego can provide you with ready-to-use fleet management solution, or customise one to the specific needs and size of your business. We work alongside you as a telematics partner to maximise your ROI.
Inseego is a global leader in SaaS (Software as a Service), IoT (Internet of Things) and mobile solutions. This gives us access to a wealth of leading-edge telematics research, which can be used to provide a more feature-rich fleet tracking software solution.
How do I introduce GPS fleet tracking to my team?
It’s good you are planning to introduce it to the team; this is an important step in improving the success of deploying GPS vehicle tracking across your fleet. Honesty and transparency will help clear up any misunderstandings they may have about fleet tracking.
Firstly, try to anticipate what questions they may have about GPS tracking: Do they not trust us? Will it be used to punish or overwork us? Is it legal? Is it fair? What information is being collected, and will drivers have access to their data
While GPS fleet tracking is commonly used across both private and public fleets, field service workers will want to know how the technology will apply to them specifically. Reassure them the focus is on improving overall business efficiency, ease of management, minimising paperwork and reducing operating costs. These benefits of GPS fleet tracking help employees too, in several ways:
- Creating a more profitable business increases job security
- A driver’s safe, efficient performance behind the wheel can now be proved (and rewarded) with GPS reports
- Vehicle trackers can minimise the need for paper logbooks and manual time tracking
- Supervisors can now track vehicle locations and see fleet activity in real time, improving coordination of resources and reducing interruptions to drivers with ‘where are you’ calls
- Drivers can monitor and self-manage their safety performance
- Managers can protect drivers from false damage claims or liability in the event of an accident
- Location data can help speed up emergency response
- Tracked vehicles can improve vehicle maintenance and reduce the chance of breakdowns
Work with your team to develop fair policies that improve adoption and reduce the chance mobile workers will feel ‘picked on’ or that it is an invasion of their privacy.
Inseego consultants can help you to roll out GPS tracking across your business, with advice and suggestions on ways to implement fleet management software that is best for you, your business and your drivers.
Is GPS tracking expensive?
Pricing for GPS fleet tracking depends on the specific requirements of your solution, and the number of assets to be tracked.
Our product specialists will work with you to understand your business requirements so they can recommend the most suitable solution for you. You also have the option to purchase the hardware, or rent if that suits your cash flow better.
Inseego is focused on delivering a positive ROI through savings on fuel costs, vehicle maintenance, efficiency and more. This means that in time the solution can actually pay for itself, making it a very viable option for your business.
How do I get started with GPS fleet tracking?
Getting started is easy. Contact us today, let us know a little bit about your fleet and what you would like to achieve and one of our consultants will be in touch to explain how our GPS fleet software works, and an overview of the installation process.
You can also request a demonstration of the fleet tracking software so you can see the GPS tracking in action.
Our telematics consultants have experience with a wide range of different industries and fleet sizes so are in a good position to suggest what features and functions would suit your business best.
How does installation work?
Part of setting up fleet tracking software involves installing GPS tracking devices on vehicles (cars, trucks etc.) and other tracked assets (e.g. trailers, equipment, containers etc.).
Our nationwide team of experienced and directly-employed technicians are qualified, trained and insured to work on any vehicle, ensuring the entire installation process is streamlined. Appointment times are flexible allowing you to schedule an installation time that minimises any disruption to your business (allow approximately one hour for installing a basic GPS tracking device).
Will I receive customer support and training?
Yes, Inseego are committed to working alongside you as a telematics partner, helping you maximise the benefit and ROI of your new fleet tracking solution. We offer a range of support and training services, designed to fit with the needs of your business and help your staff integrate the software with their daily processes.
Support and training options include:
- Help desk for fast and ready access to technical support
- Remote support to diagnose, troubleshoot and resolve technical issues
- Onsite or remote training workshops to upskill staff
Adding new technology to your business can create some anxiety - our support and training services are designed to make the process of implementing GPS tracking as seamless and trouble-free as possible.
Can I add more vehicles in the future?
Yes, you can update your plan to include additional vehicles (or other GPS tracked assets) at any time.
Simply contact us to let us know and we’ll organise the change (and can schedule the installation of the tracking devices if you like).
What GPS tracking hardware can be supplied?
For most vehicles, a standard, wired device is fitted, however other types of GPS tracking devices are available including battery powered trackers for non-powered assets (such as containers or trailers).
Let us know if you have specific data collection requirements — in most cases the standard GPS tracking hardware is sufficient for the needs of everyday fleet management.
Where is my data stored?
Inseego’s Irish client data is hosted by Rackspace in full compliance with current security and GDPR Legislation. Rackspace are the preferred hosting partner of Government, Local Authorities, Defense, Blue Light and large corporates. Our server infrastructure has been designed with no single point of failure and is monitored and supported 24/7/365 keeping your data accessible and secure at all times.